When you connect a wearable app or device to your League account, we track and give you the following insights into your data:
-
High-level details about your most recent data and week-over-week trends.
-
Graphs that show your weekly and monthly data and averages.
-
Detailed lists of all the data we record for each data point you give us access to.
-
Information about each data point to help you understand and interpret your data.
Keep reading to learn how to:
Access your wearables data
See instructions for:
On mobile:
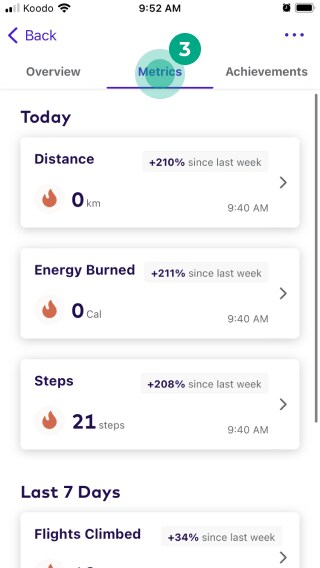
1. Tap the profile icon.

2. Scroll down to the “Your metrics” section, where you can view a list of:
-
All the data points you’re tracking, with your most recent data at the top of the list
-
Your most recent data
-
Week-over-week trends
-
Timestamps of when we last collected each data point
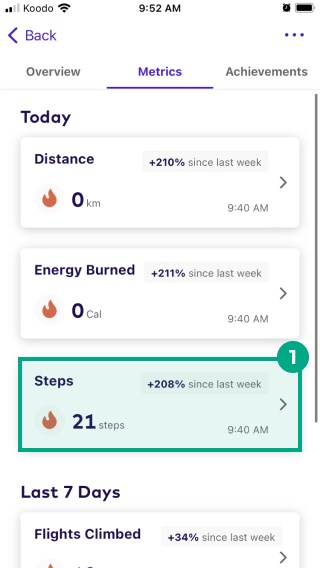
3. Tap “Metrics” to find more detailed information about your data, including:
-
A list of all the data points you’re tracking, organized chronologically by when we last received the data from your wearable app or device (Today, Past 7 days, Past 30 days, or Older)
-
A list of the data points you’re not tracking (under the “No Data Available” heading)
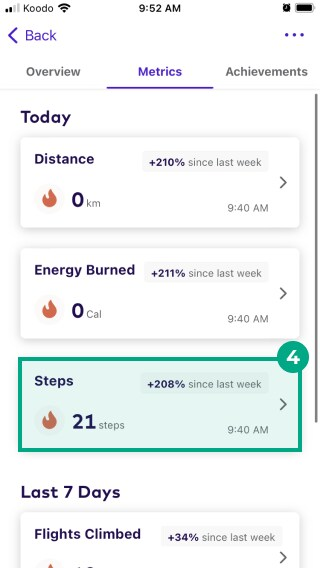
4. Select a data point from the list to view a graph of your weekly and monthly data and averages.
On web:
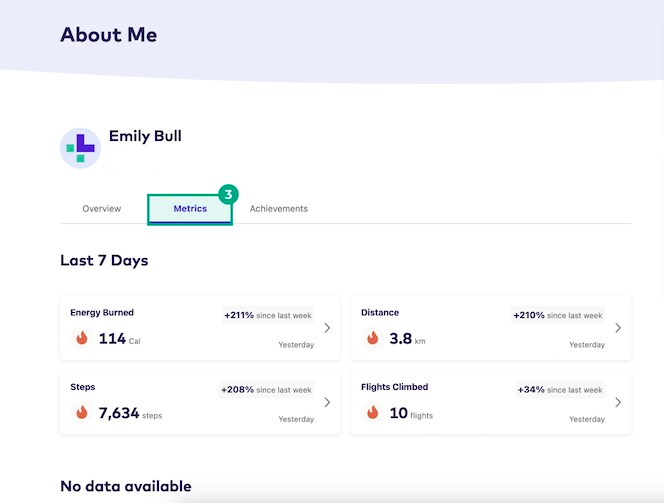
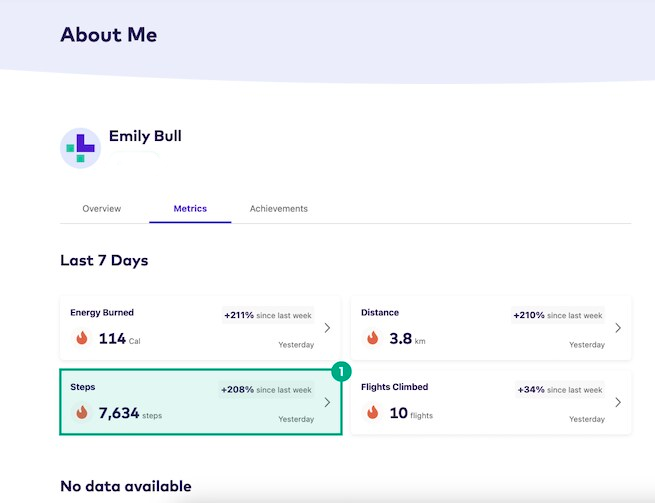
1. Click “About Me”.
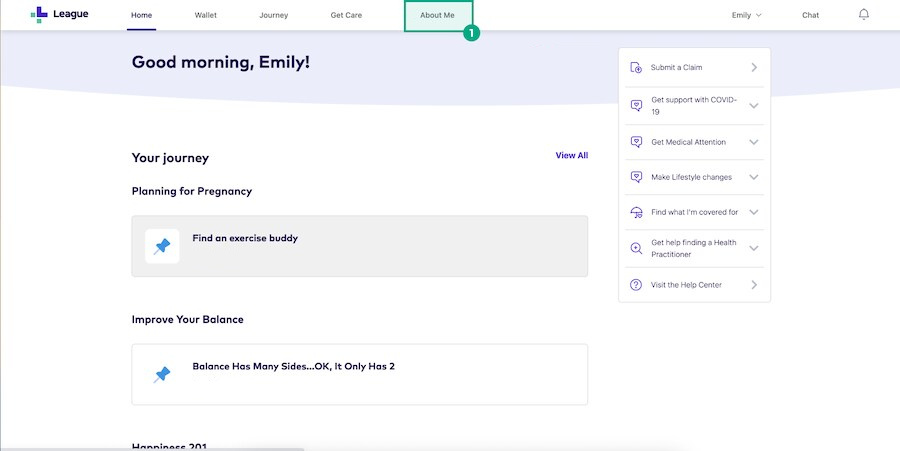
2. Scroll down to the “Top Insights” section, where you can view a list of:
-
Any data points you’ve tracked in the last eight days
-
Week-over-week trends
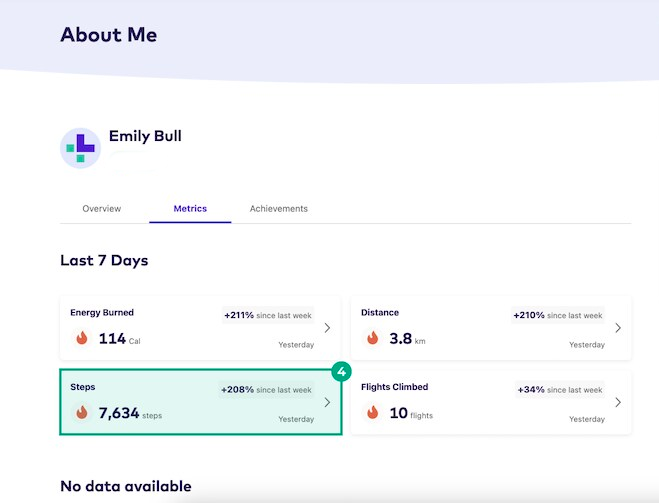
3. Click “Metrics” to find more detailed information about your data, including:
-
A list of all the data points you’re tracking, organized chronologically by when we last received the data from your wearable app or device (Today, Past 7 days, Past 30 days, or Older)
-
A list of the data points you’re not tracking (under the “No Data Available” heading)
4. Select a data point from the list to view a graph of your weekly and monthly data and averages.
View your data visualization
See instructions for:
On mobile:
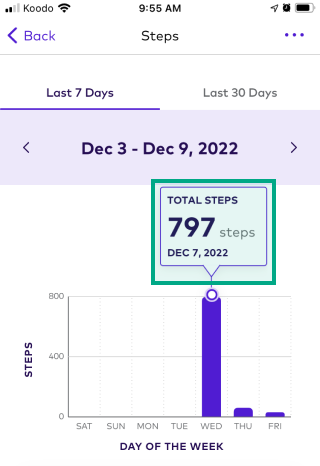
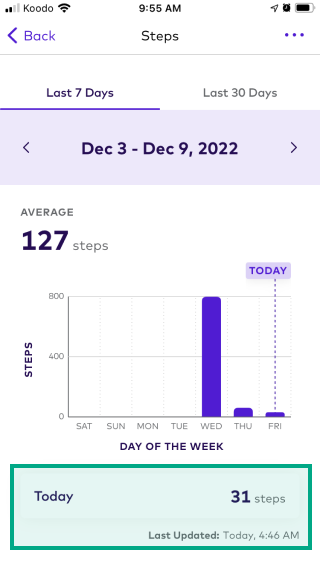
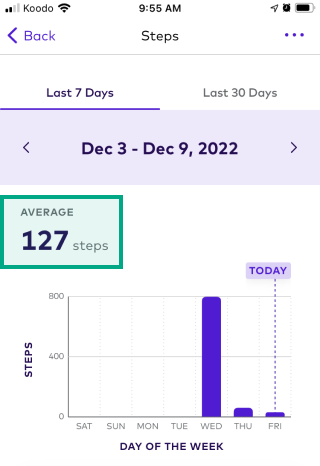
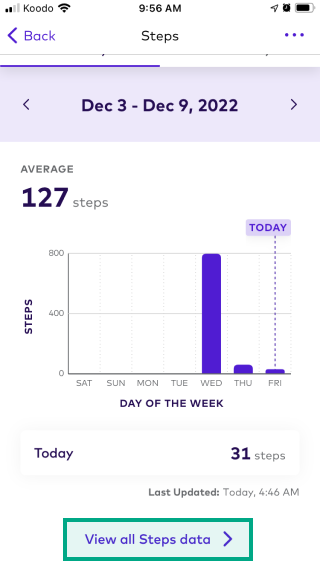
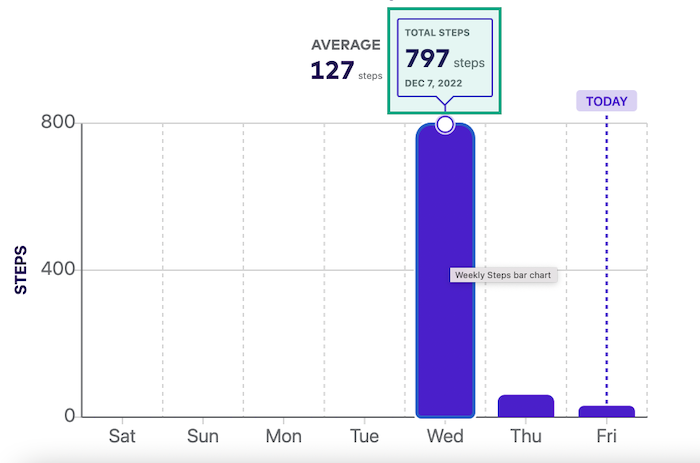
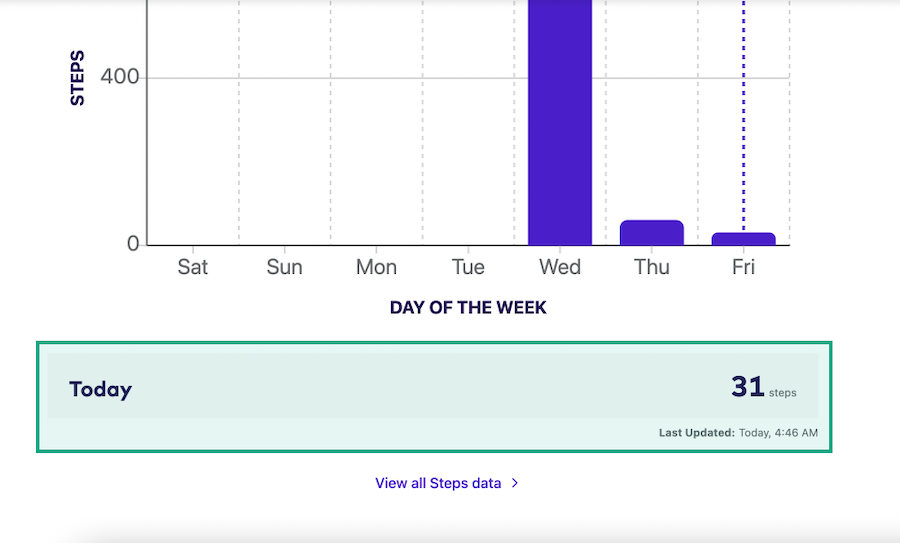
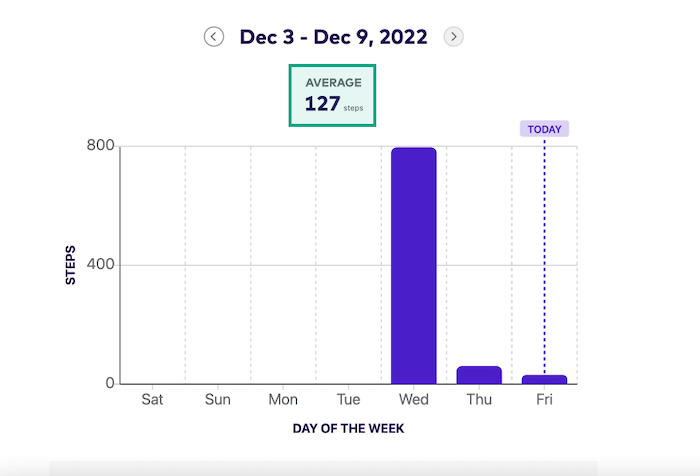
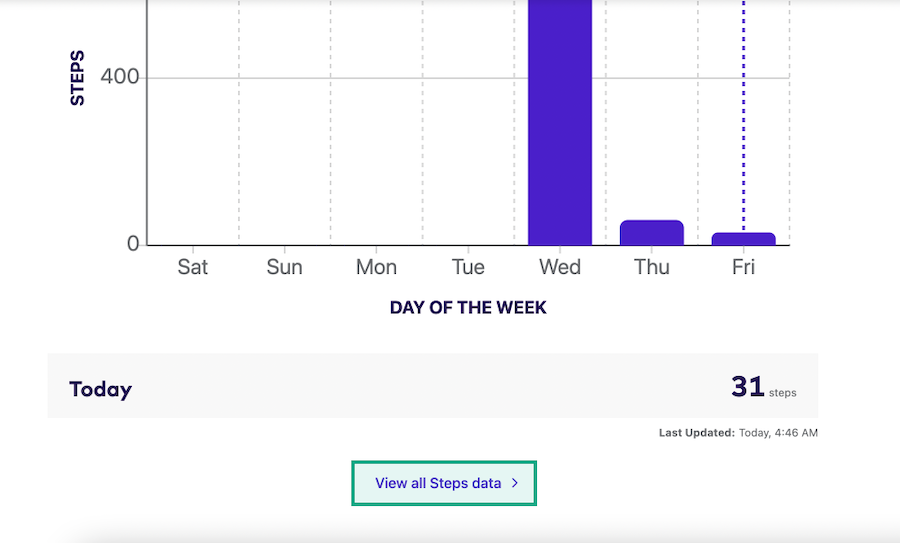
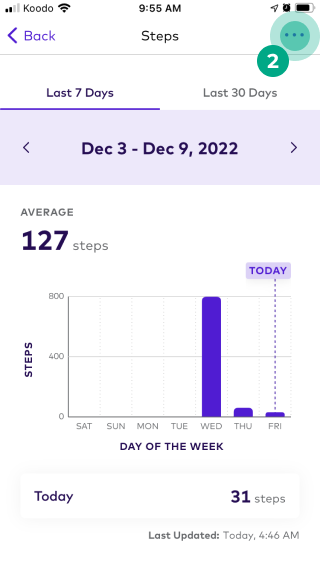
When you select a data point from your metrics, we display a graph that shows your data over a period of time. You can:
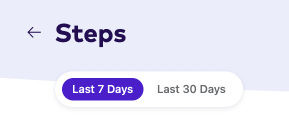
-
Switch between the visualization of weekly or monthly data
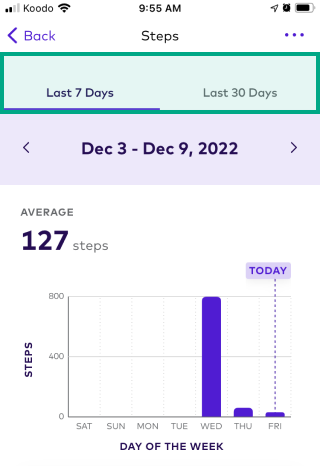
-
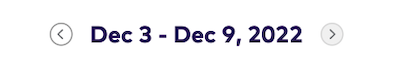
Pick a specific week or month’s data
-
Select a bar on the graph to view the data for that week or day
-
View your latest reading and a timestamp of when we last received the data from your app or device
-
View an average reading (the average of all the days that are in the graph)
-
Select “View all data” to view a full list of the historic data we’ve received for that data point
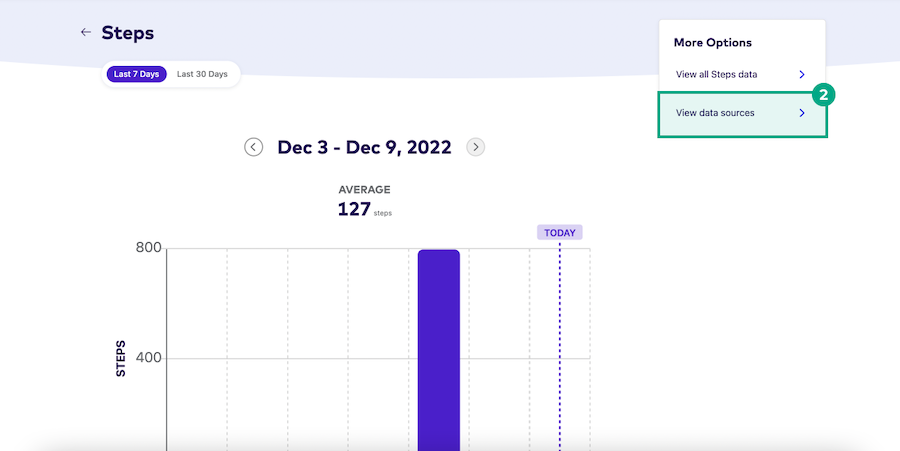
On web:
When you select a data point from your metrics, you see a graph that shows your data over a period of time. You can:
-
Switch between the visualization of weekly or monthly data
-
Pick a specific week or month’s data
-
Select a bar on the graph to view the data for that week or day
-
View your latest reading and a timestamp of when we last received the data from your wearable app or device
-
View an average reading (the average of all the days that are in the graph)
-
Select “View all data” to view a full list of the historic data we’ve received for that data point
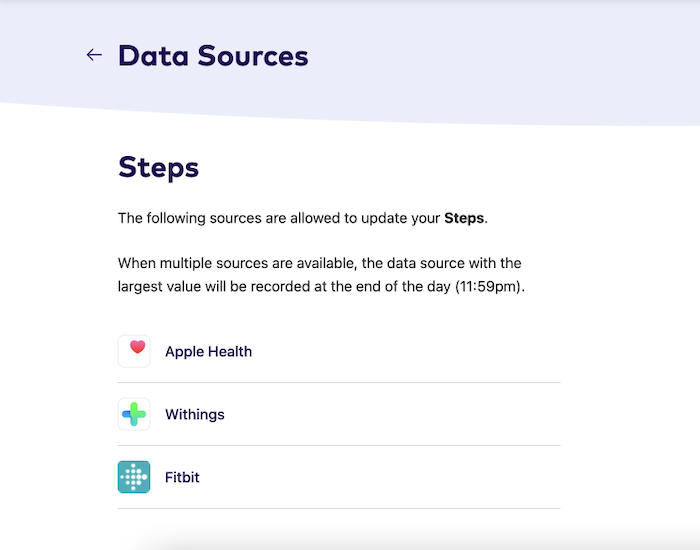
View your data sources
When you select a data point from your metrics, you can find out what wearable apps and devices are sending us that data point.
See instructions for:
On mobile:
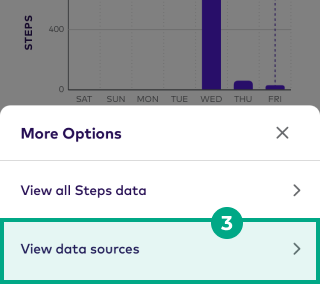
To view the data source for a specific data point:
1. Select a data point from your metrics.
2. Tap the ellipsis icon (3 dots).
3. Tap “View data sources.”
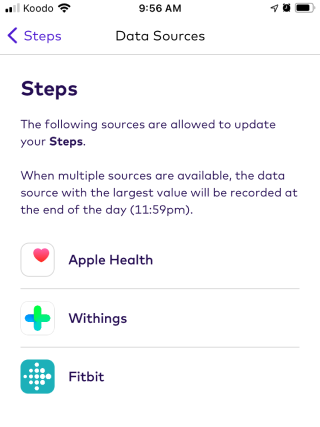
You’ll now see a list of the wearable apps and devices that are sending us the data point. If you want to update your data source, learn how to manage the data your wearable app or device shares with your League account.
On web:
To view the data source for a specific data point:
1. Select a data point from your metrics.
2. Click “View data sources.”
You’ll now see a list of the wearable apps and devices that are sending us the data point. If you want to update your data source, learn how to manage the data your wearable app or device shares with your League account.